
 ← All stories
STORM FILE · Stormchasing
WEATHER EXPLAINED · POLAR VORTEX · AS OF 26 OCTOBER 2026
The weather models show a much weaker polar vortex in early November. A split is also possible. That is an interesting development, but it does not yet tell us whether Germany will get cold weather or snow. I want to explain what the charts show — and what we cannot read into them yet.
Research and access date: evening of 26 October 2026. An assessment of the outlook for early November, not a forecast for the whole of winter 2026/27. The individual model run times are listed below.
01 / FIELD NOTE
What is behind those striking weather charts?
Charts like these can quickly make you think of a spell of wintry weather. The connection seems obvious, but it is not that straightforward. A change high above the Arctic tells us little, on its own, about the weather that may reach us some time later.
The ECMWF chart for 3 November, checked on 26 October, shows a strongly distorted upper-air pattern with two distinct centres. The GFS forecast for the same time also shows a two-centred pattern. That makes a possible split worth watching. It does not prove that a split has already happened, or that wintry weather will follow in Germany. ECMWF forecast · GFS forecast.

What interests me most is what this development could mean for our weather. That is why it deserves a closer look. The evidence available so far is not enough to announce an especially cold or snowy winter.
02 / FIELD NOTE
What happens above the Arctic?
Before looking at the models, it helps to look upwards: where exactly is the polar vortex, and how far above the layer where our weather happens?
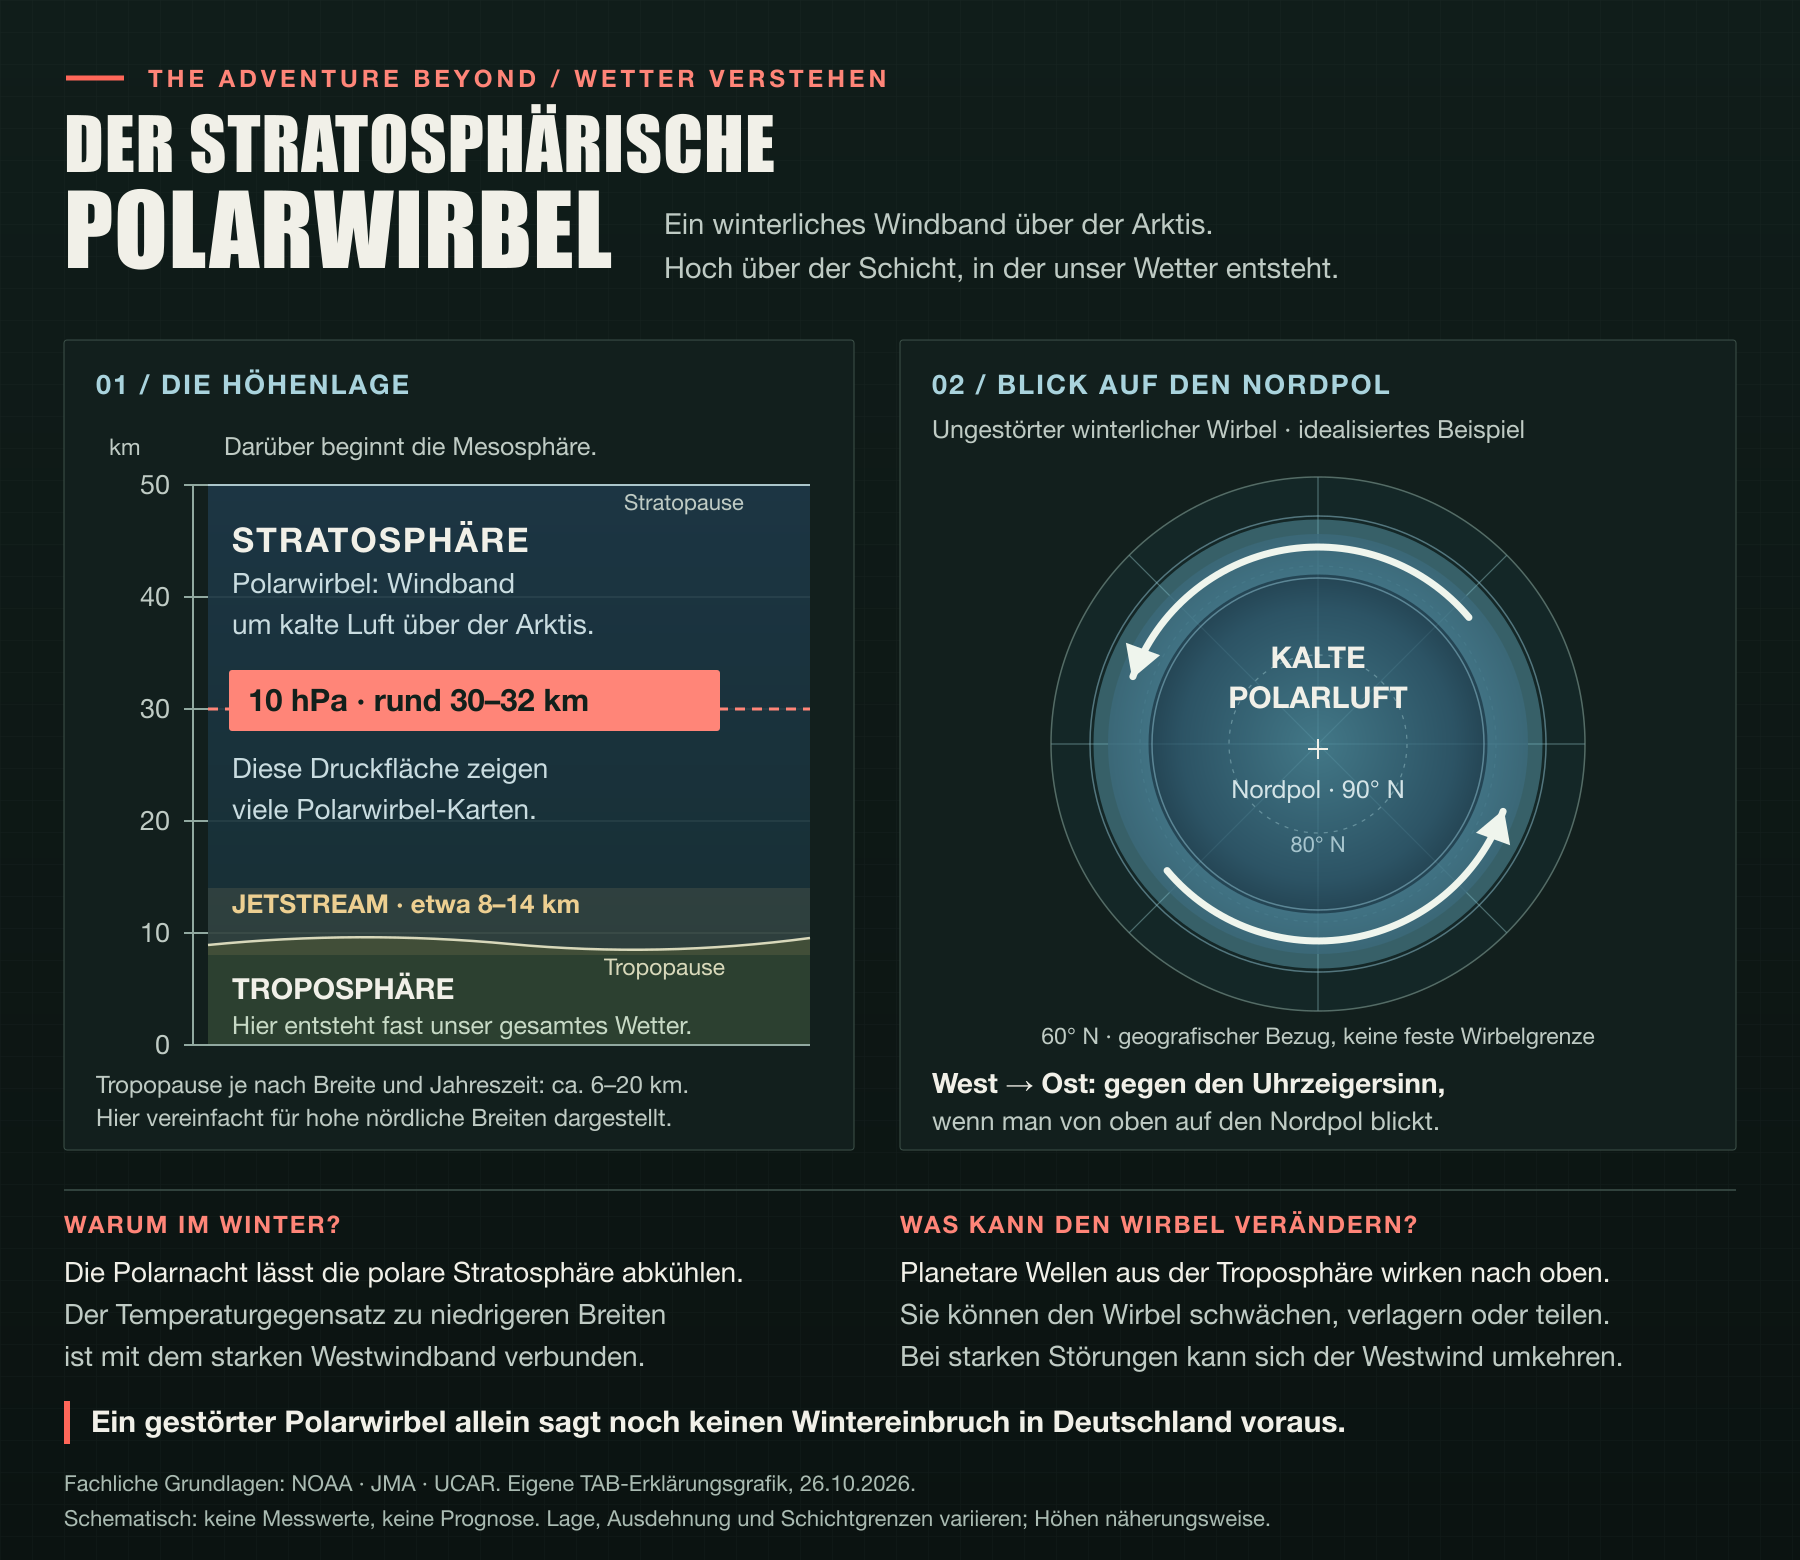
Here we are looking at the stratospheric polar vortex: a large-scale winter circulation in which strong westerly winds flow around cold air above the Arctic. The stratosphere sits above the troposphere, the lower atmospheric layer where our everyday weather takes place. Source: NASA Ozone Watch.
The charts refer to 10 hectopascals, or 10 hPa. This is a pressure surface roughly 30 to 32 kilometres above the ground; its exact altitude changes with the state of the atmosphere. The key point is that these charts describe conditions high in the atmosphere, not the amount of snow we should expect here. Source: Japan Meteorological Agency (JMA).
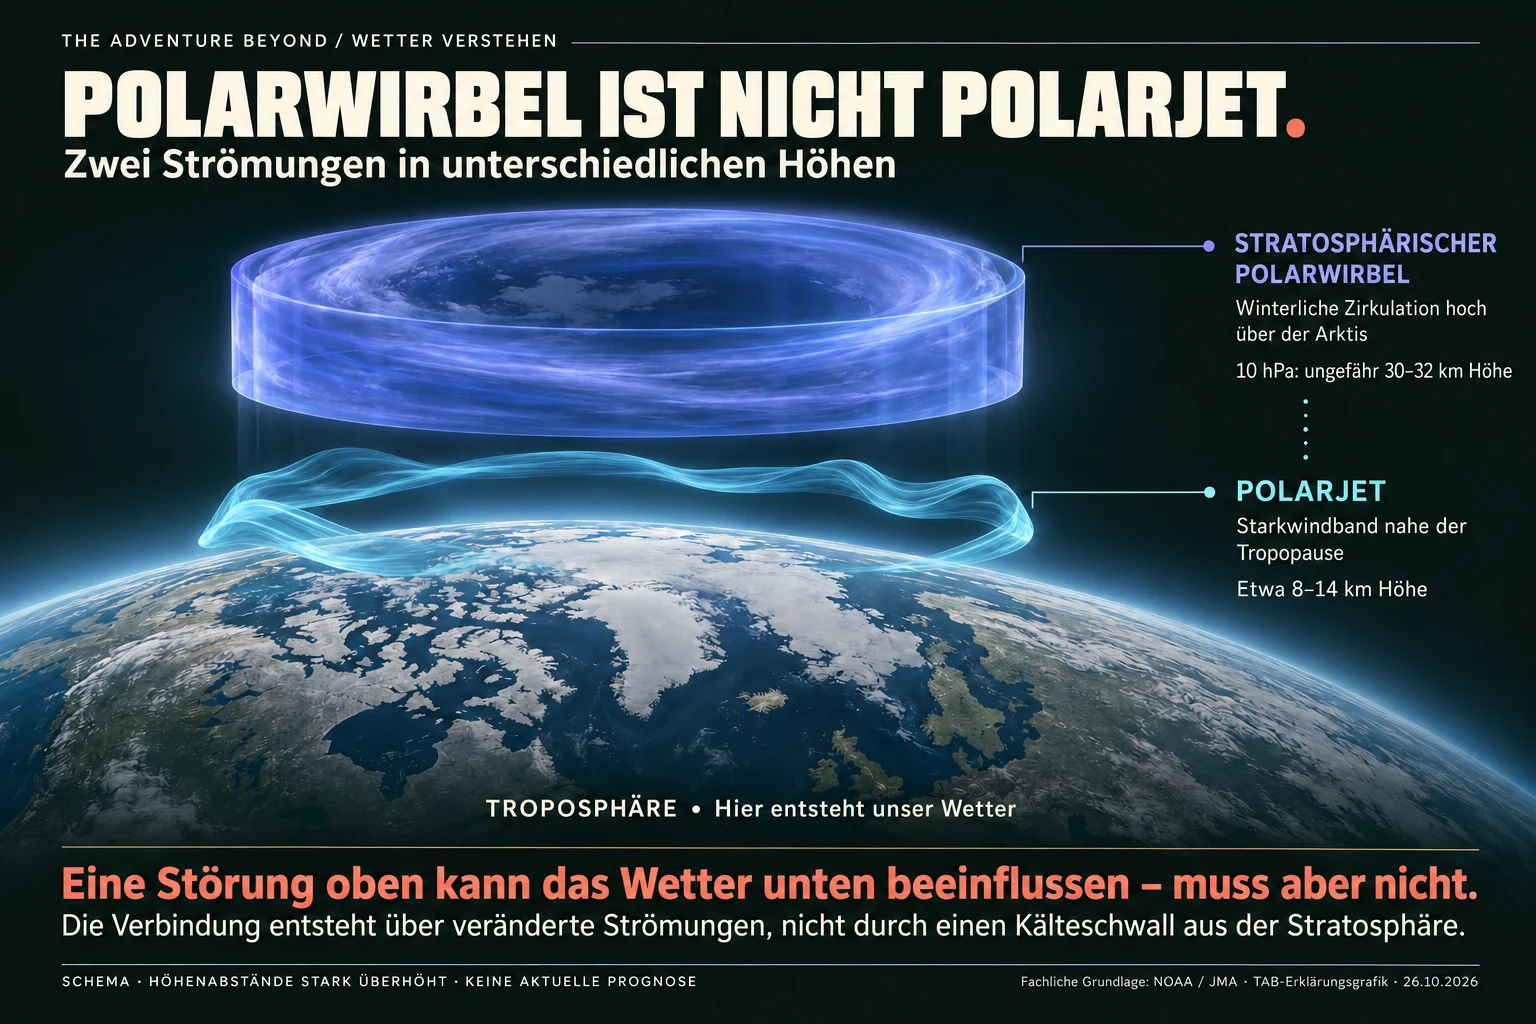
An important role is played by planetary waves. These are very large-scale wave motions that, under suitable conditions, can propagate from the lower atmosphere into the stratosphere. There they transfer momentum and can slow the westerly winds. The resulting circulation changes can also warm the polar stratosphere. JMA: how stratospheric warmings develop.
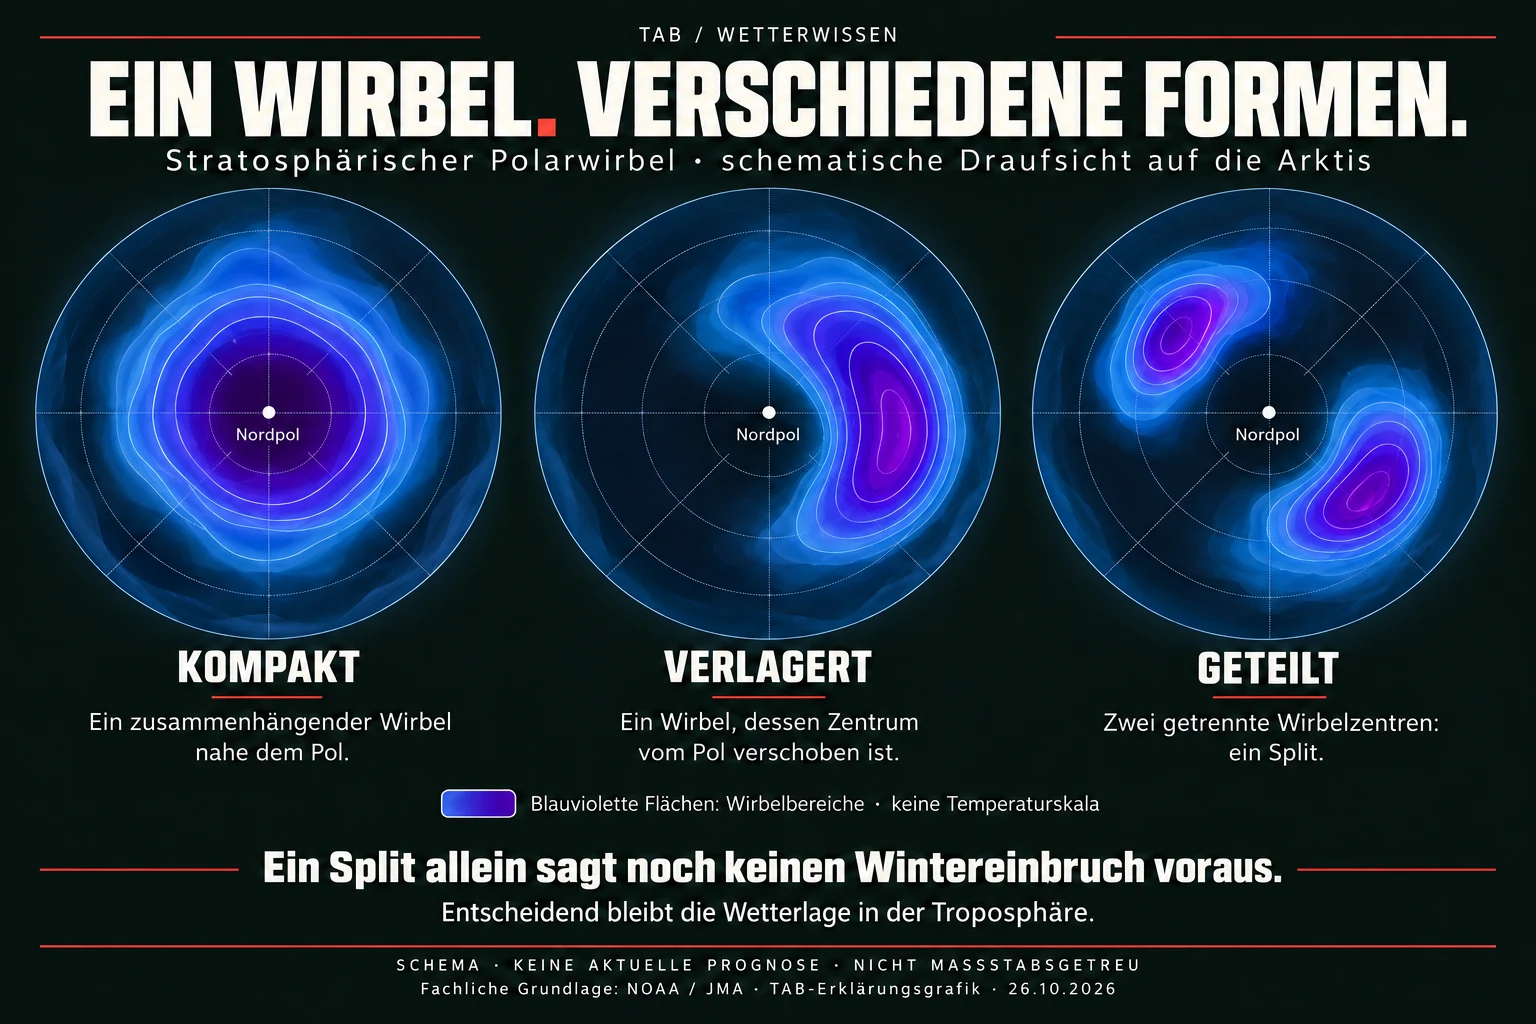
As a result, the vortex can shift, become stretched out or divide into separate centres. This division is called a Split. The NASA charts below show a historical example. They help explain the process, but do not depict the current development. NASA: historical vortex evolution.
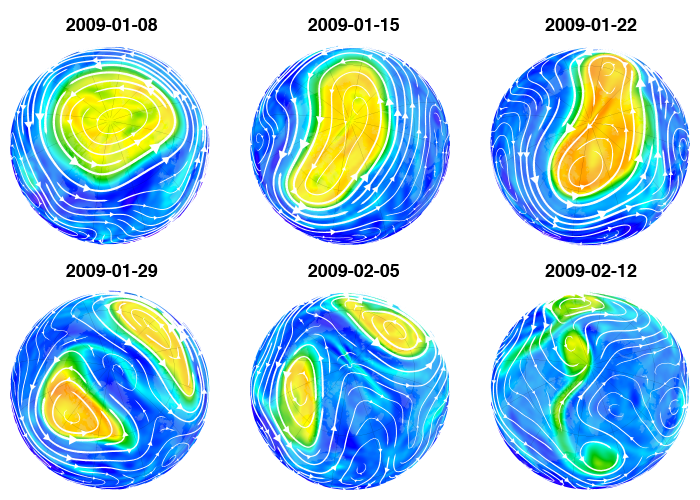
How to read the historical sequence: On 8 January 2009, the vortex is still fairly compact. By 22 January it has become elongated and shifted. The chart for 29 January shows two separate areas. The later images show further weakening. The colours depict the structure of the vortex — not snowfall amounts or temperatures at ground level. The six charts are spaced one week apart. Source: NASA Ozone Watch.
03 / FIELD NOTE
Weakening does not necessarily mean a split
Three terms need to be kept separate. During a weakening the average westerly wind slows down. A Split describes the division of the vortex. A major SSW is a major sudden stratospheric warming, diagnosed using additional criteria.
Under the widely used research definition applied here, one requirement is a reversal of the daily, zonally averaged wind at 60° N and 10 hPa from westerly to easterly. Further timing criteria distinguish individual events. Two centres on a chart, or a local easterly wind, are therefore not enough. NOAA/CSL: definition and event criteria.
04 / FIELD NOTE
What the checked models show
The access date and model run time are not the same thing. This matters particularly for the wind ensemble: when accessed on 26 October, the available run was still the one from 25 October.
| Product and model run | Forecast time | Findings and limitations |
|---|---|---|
| ECMWF/IFS ensemble mean 26.10.2026, 00 UTC | 03.11., 00 UTC +192 hours Temperature and geopotential at 10 hPa | Strongly distorted, two-centred pattern. A split scenario is possible, but this is not an objective split diagnosis or a calculated probability. |
| ECMWF Subseasonal 25.10.2026, 00 UTC | Early November Wind at 60° N and 10 hPa | Marked weakening. The ensemble mean remains positive over the period considered, while individual members turn negative. |
| NOAA/NCEP GFS 26.10.2026, 00 UTC | 03.11., 00 UTC +192 hours Geopotential at 10 hPa | Disturbed, two-centred pattern. A single forecast, not confirmation that an event has occurred. |
| DWD medium-range outlook 26.10.2026, 10:30 UTC | Until 2 November 2026 Weather in Germany | High pressure predominates. Uncertainty increases from the weekend onwards. No separate assessment of ICON stratospheric output was made. |
Direct links to the products: ECMWF upper-air chart · ECMWF wind ensemble · GFS upper-air chart · DWD medium-range outlook. These live product URLs may show newer output later.
An ensemble is a set of different model calculations. In the ECMWF wind chart, thin blue lines represent individual members and the thick blue line their mean. The red lines describe the model climate. Individual curves below zero therefore do not yet establish a reliable wind reversal. ECMWF: chart and explanation.
One more point of context: both ECMWF products belong to the same model family, IFS. They cover different forecast ranges, but they are not two independent models. That matters when comparing their results.
05 / FIELD NOTE
What does this mean for Germany?
For the nearer-term outlook, the DWD medium-range report is more specific than a stratospheric chart. The report from 26 October initially describes mostly quiet weather under high pressure, with increasing fog and low cloud. It remains mild where the sun comes out for longer. DWD, issued 26 October 2026, 10:30 UTC.
The models differ for Sunday 1 November: GFS takes a front farther across Germany, whereas ICON and IFS largely confine frontal rain to the north-west. Uncertainty grows from that point onwards. This does not support an imminent, widespread spell of wintry weather. Source: DWD medium-range outlook.
A stratospheric disturbance can influence the circulation below. This coupling may occur with a delay and does not develop in the same way in every event. What matters is how areas of high and low pressure, and the airflows between them, arrange themselves in the lower atmosphere. Not every disturbance brings cold air into central Europe. Met Office: effects on surface weather.
For our weather, then, it is the development of the lower-level airflows that matters. Nor can the current high-pressure weather simply be explained by a stratospheric disturbance that is only forecast for November.
06 / FIELD NOTE
Looking back: two events, different outcomes
Past events help put today's charts into perspective. But they are not templates that the next winter will simply repeat. Comparing 2018 and 2019 makes that particularly clear.
February 2018: a cold spell followed the disturbance
On 12 February 2018 the wind used for the diagnosis reversed and the polar vortex split. This is documented by NASA, including a historical animation. In late February and early March, Britain experienced a pronounced spell of cold weather and snow. The Met Office report on that event describes, among other features, high pressure over Scandinavia and cold easterly winds. In this case, the lower-level weather pattern was favourable too.
January 2019: no comparable effect in Britain
There was also a major stratospheric warming in early January 2019. The NOAA records date it to 1 or 2 January, depending on the reanalysis. Yet there was no comparable effect on British weather. This is explicitly noted by the Met Office in its retrospective assessment explicitly. The example concerns Britain, not Europe as a whole.
For me, this comparison makes the key point tangible: the disturbance high up is one part of the picture. What happens at the surface also depends on the wider weather pattern. Two examples cannot tell us the probability of an event, or provide a forecast for November 2026.
For further reading, the NOAA SSW archive compares several reanalyses. The table used here covers 1958 to 2023 and was last updated in September 2023. Reanalyses combine past observations with weather models. The list records major stratospheric warmings, not necessarily split events or snowy winters.
07 / FIELD NOTE
My verdict
The models point to marked weakening. A split is possible. What that means for our weather remains an open question.
I find the development interesting, but I would not plan my trips around it yet. When I head out in the Jeep or spend a weekend outdoors, the local forecast shortly before departure is what counts. It is worth following the next model runs for early November. They do not yet allow a reliable judgement about the winter as a whole.
08 / FIELD NOTE
Frequently asked questions
Has the polar vortex already split?
The charts checked here do not establish that. They are forecasts for early November, not observations of a split that has already happened.
Does a split automatically bring snow?
No. Whether it snows where you are depends on the actual weather pattern, temperatures and precipitation. A stratospheric disturbance alone does not decide that. Met Office.
Can a split be followed by a very cold spell?
Yes, that is possible, but it is not automatic. Such splits have been known for decades and occur from time to time. What matters is whether the circulation in the lower atmosphere also changes in a way that allows cold air to reach central Europe. That can bring a period of very cold weather. A split alone does not tell us whether Germany will be affected, or how intense or prolonged a cold spell might be. This concerns a possible spell of winter weather, not a lasting change in climate. Met Office: possible effects on the weather · Charlton and Polvani: historical split events.
Why do the forecasts differ?
Models and ensemble members produce different possible outcomes. That is why striking individual charts are not enough: agreement between forecasts, their spread and the way later runs develop all matter too.
09 / FIELD NOTE
Sources and transparency
This article reflects the information checked on the evening of 26 October 2026. The ECMWF upper-air chart, ECMWF wind ensemble, GFS upper-air chart and DWD report were opened directly. The wind ensemble was still based on the 25 October run. No original model calculations or event probabilities were produced. A forecast does not confirm that an event has already occurred.
Background sources: NASA Ozone Watch · JMA · NOAA/CSL · Met Office. Historical illustrations are labelled as such. They do not prove that an event will occur in November 2026.